Opportunity Zones · Iowa · 2018–2027
Iowa's 62 Opportunity Zones: designation, investment and 2027 eligibility
Iowa designated 62 of the 242 low-income tracts it was eligible to nominate. This compares those tracts with the 181 that were eligible and not designated, reports investment through tax year 2024, and matches each zone against the 2027 eligibility rules.
The Tax Cuts and Jobs Act let each governor designate up to 25% of their state's low-income community tracts as Opportunity Zones. Iowa had 242 to choose from and took 61, plus one tract that qualified only by sitting next to a poor one — exactly the maximum the statute allowed.
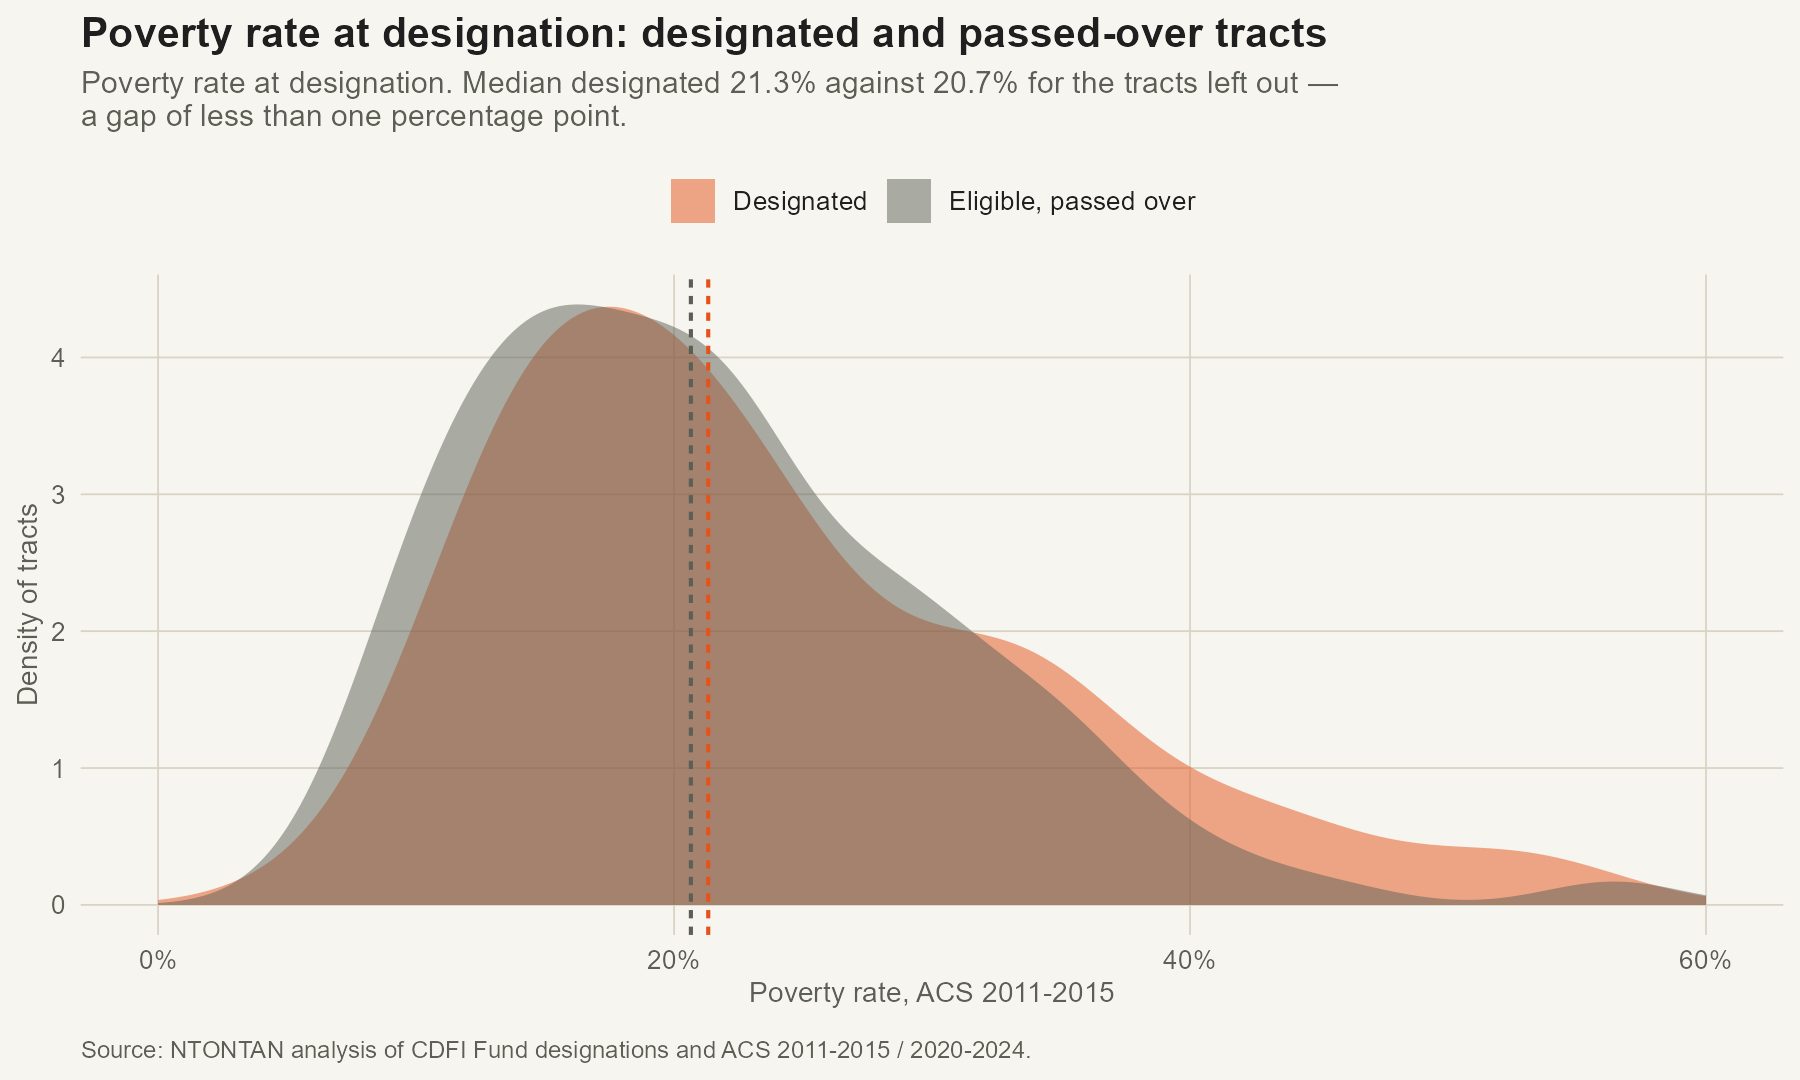
Because eligibility required poverty, comparing designated zones with the country as a whole carries little information. The comparison used throughout is against the tracts that were eligible and not designated. Iowa's designated tracts had a median poverty rate of 21.3%, against 20.7% for the 181 tracts not designated — a difference of 0.7 percentage points.
Designation against the eligible pool
Plotted as distributions rather than medians, the two groups largely overlap. Iowa's designated tracts sit at a mean of the 54th percentile of its own eligible pool; 50 is the value random selection would produce.
State values vary widely. Georgia's designated tracts averaged the 81st percentile of its eligible pool, with a poverty gap of 14.4 points; Illinois and California exceeded 11 points. Iowa's 0.7 is near the low end of the national range, with New Mexico, West Virginia and Mississippi.
Tract map
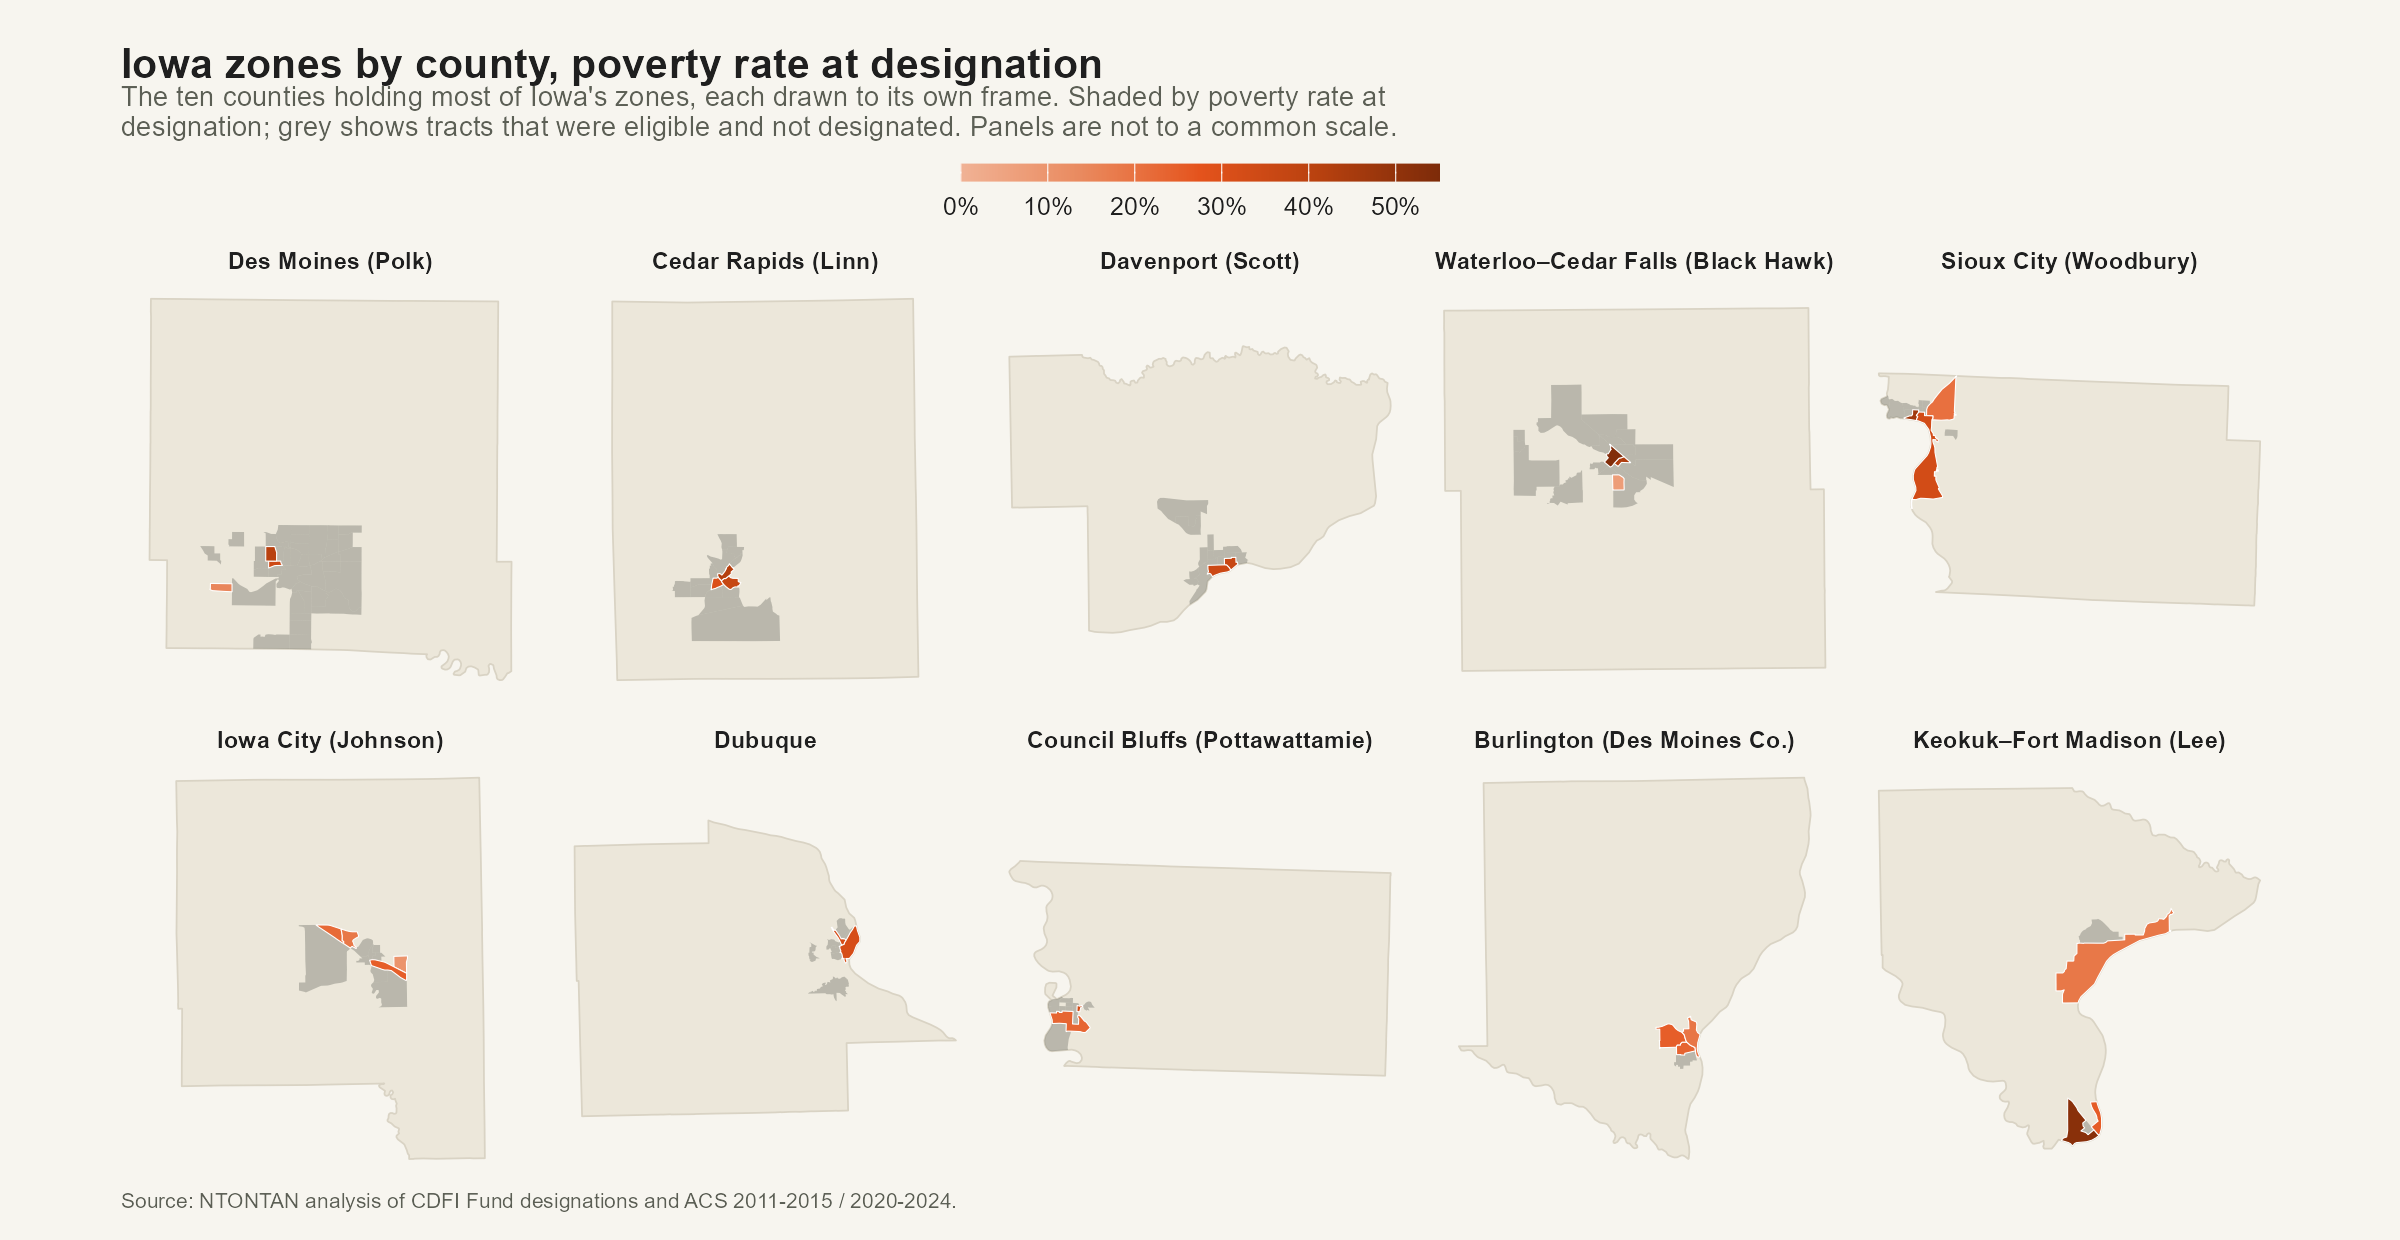
All 62 designated zones, with the 181 tracts that were eligible and not designated. Hover or tap any tract for detail.
Boundaries are 2010-vintage census tracts, the geography the designation is legally fixed to.
Geographic distribution
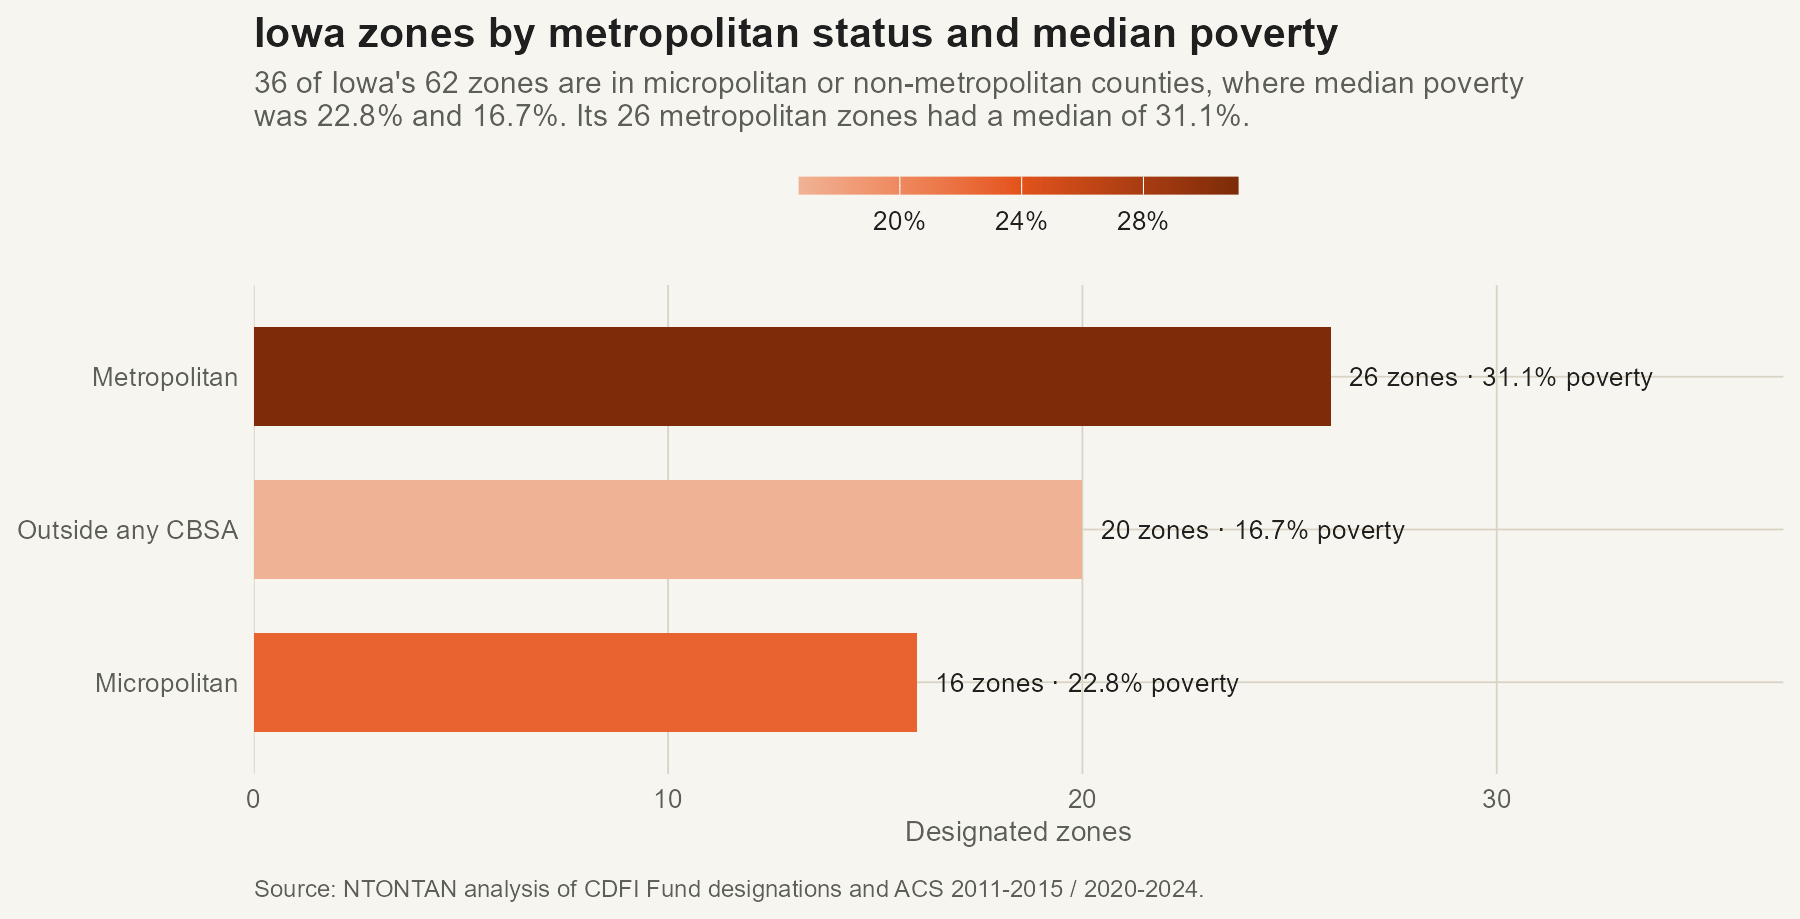
Thirty-six of the 62 zones are in micropolitan or non-metropolitan counties, most of them one or two per county. Median poverty was 16.7% in the non-metropolitan zones and 22.8% in the micropolitan ones, against 31.1% in the 26 metropolitan zones.
Reported investment
Through tax year 2024, qualified opportunity funds reported holding $80 million of property in Iowa's zones. Nationally the figure is $104.2 billion across 7,826 zones — about $13.3 million per zone. Iowa's zones averaged $1.3 million.
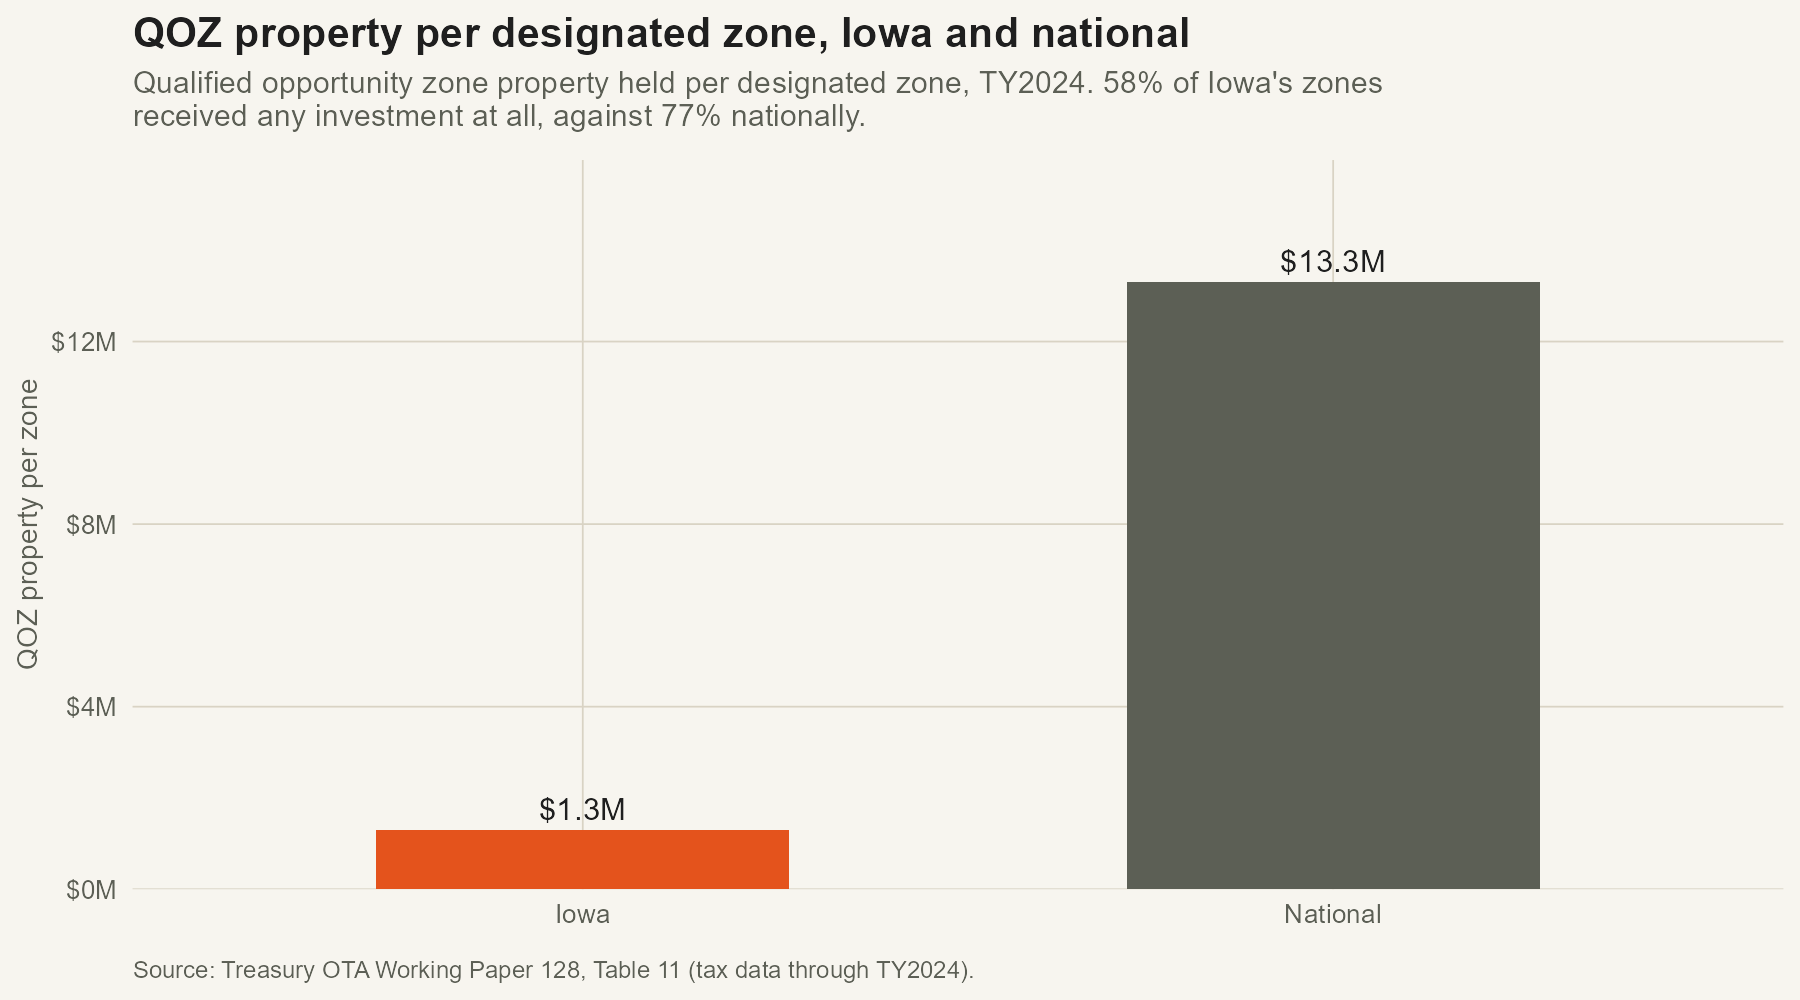
58% of Iowa's zones received any qualified investment, against 77% nationally. Of the $80 million reported, $10 million — 12.5% — was in rural zones, which account for more than half of the state's designations.
Change since designation
Comparing only tracts whose boundaries survived the 2020 census redraw unchanged, Iowa's designated tracts saw poverty fall 2.4 points between the 2011–2015 and 2020–2024 surveys. The tracts it passed over fell 4.1 points. Home values rose 44% in designated tracts against 56% in passed-over ones.
This is a raw difference between groups that were not equivalent at baseline and does not identify the effect of designation. Designated tracts started with higher poverty and more room to move.
2027 eligibility
The One Big Beautiful Bill Act made Opportunity Zones permanent and put them on a ten-year cycle, with a new round of designations from 2027. It also tightened eligibility: the income ceiling fell from 80% of the area benchmark to 70%, the poverty route picked up a 125% income cap, and the benchmark itself changed.
Matching Iowa's current zones to the new eligible universe, 25 of the 62 would not qualify again — 40%, against 27% nationally.
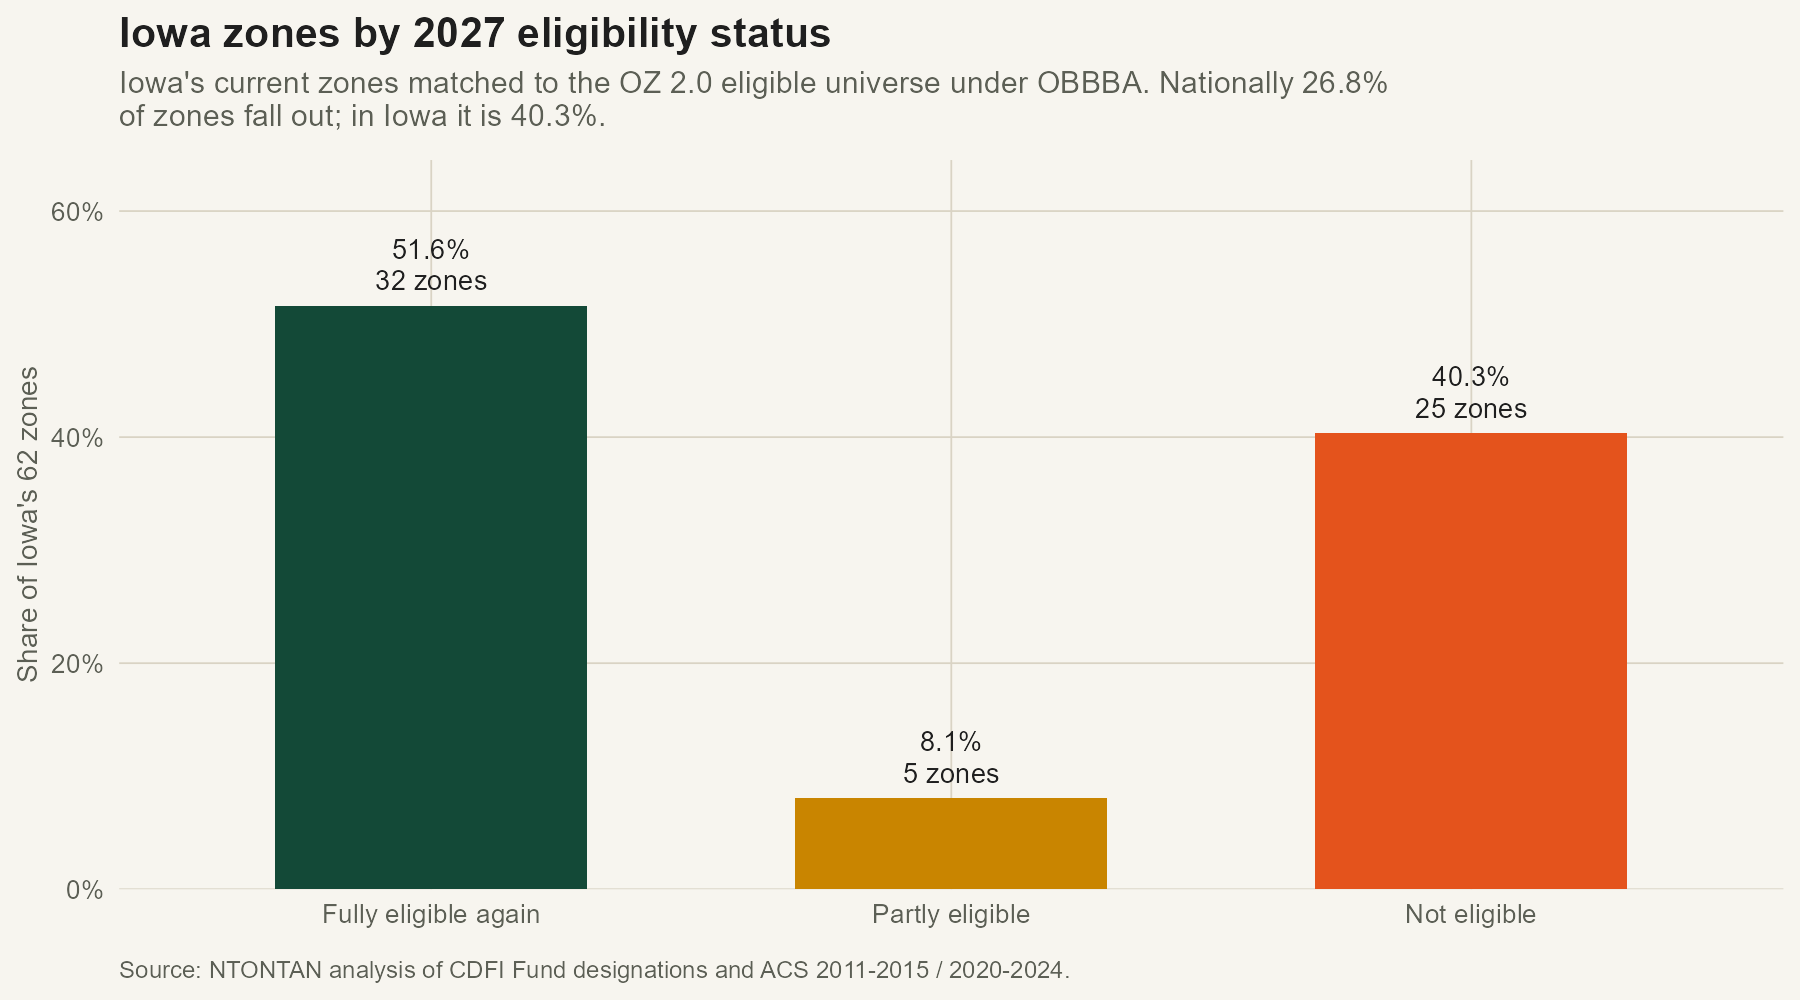
Nine of the ten Iowa designated tracts with the lowest poverty rates at designation are among those that lose eligibility.
College enrolment check
Iowa City, Ames, Cedar Falls and Grinnell are in counties containing designated zones. Student populations raise measured poverty rates above the level of household hardship in a tract, so a designation pattern weighted toward student tracts would affect the poverty figures above. This was tested using college and graduate enrolment from the same ACS vintage.
Defining a student tract as one where 25% or more of residents are enrolled in college, 2 of Iowa's 61 designated low-income zones qualify, against 18 of the 181 not designated — 3.3% and 9.9% respectively.
Excluding student tracts from both groups, the median poverty rate is 20.5% among designated tracts and 19.3% among those not designated, a difference of 1.2 percentage points rather than 0.7.
Iowa and national figures
| Measure | Iowa | National |
|---|---|---|
| Designated zones | 62 | 7,826 |
| Share of eligible pool designated | 25.2% | 25% cap |
| QOZ property per zone | $1.3M | $13.3M |
| Zones receiving any investment | 58% | 77% |
| Median poverty, designated | 21.3% | 31.0% |
| Median poverty, not designated | 20.7% | 23.8% |
| Rural share of the state's investment | 12.5% | 16.1% |
| Zones not eligible under 2027 rules | 40.3% | 26.8% |
Sources and method. Designations from the CDFI Fund's Opportunity Zone
list (Notices 2018-48 and 2019-42). Tract characteristics from the American Community Survey,
2011–2015 for the designation era and 2020–2024 for current conditions, on 2010-vintage tract
boundaries. Eligibility was reproduced from the statutory low-income community test and
validates to within 0.4% of Treasury's published count. Investment figures come from Treasury
Office of Tax Analysis Working Paper 128 (Coyne & Johnson, June 2026), reporting
administrative Form 8996 data through tax year 2024.
There is no public tract-level investment data and there will not be: it derives from
confidential taxpayer returns, so Treasury publishes it only by state, tract type and income
quintile. Iowa's $80 million is a state total; it cannot be allocated to individual zones here
or anywhere else. Change-over-time figures use only tracts whose 2010 and 2020 boundaries
coincide exactly; tracts needing interpolation are flagged in the map detail.
Full methodology →