Opportunity Zones · national · 2018–2027
National designation and investment
Eligibility for designation required poverty, so comparing zones against the country carries little information. The comparison used here is between designated tracts and those that were eligible and not designated, followed by the distribution of reported investment across designated zones.
Designation rate by within-state poverty decile
Ranking each state's eligible tracts by poverty within that state, designation rates rise monotonically from the least distressed decile (15.9%) to the most (44.3%).
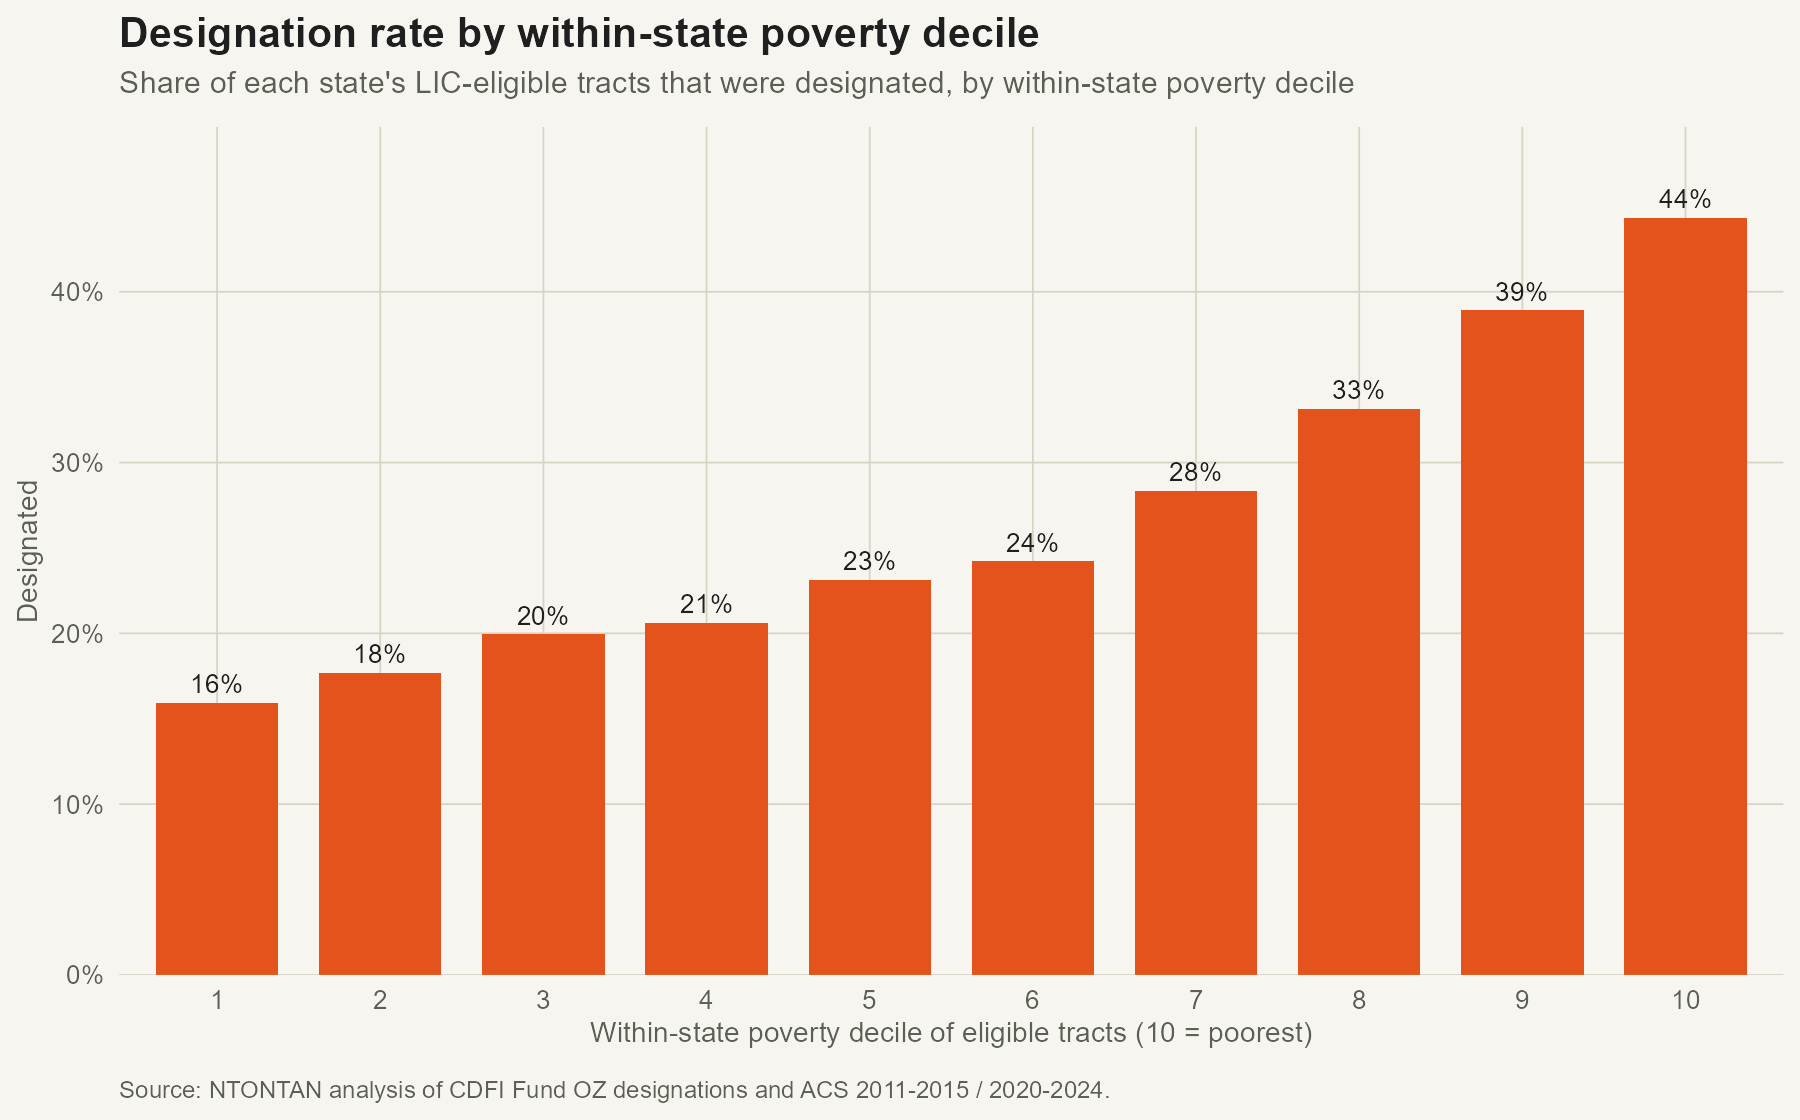
36% of designated tracts came from the less distressed half of their own state's eligible pool and 16% from the least distressed quarter. 17.5% had poverty under 20% and 6.8% had median family income above their state's median.
State-level measures
Two measures vary independently by state: the distress percentile of the tracts designated, and reported investment per zone. Hover any state.
Alaska, Hawaii and Puerto Rico are moved and scaled as insets. Puerto Rico designated every one of its 863 eligible tracts, so its targeting score is an artefact of having had no choice, and it is drawn but not ranked.
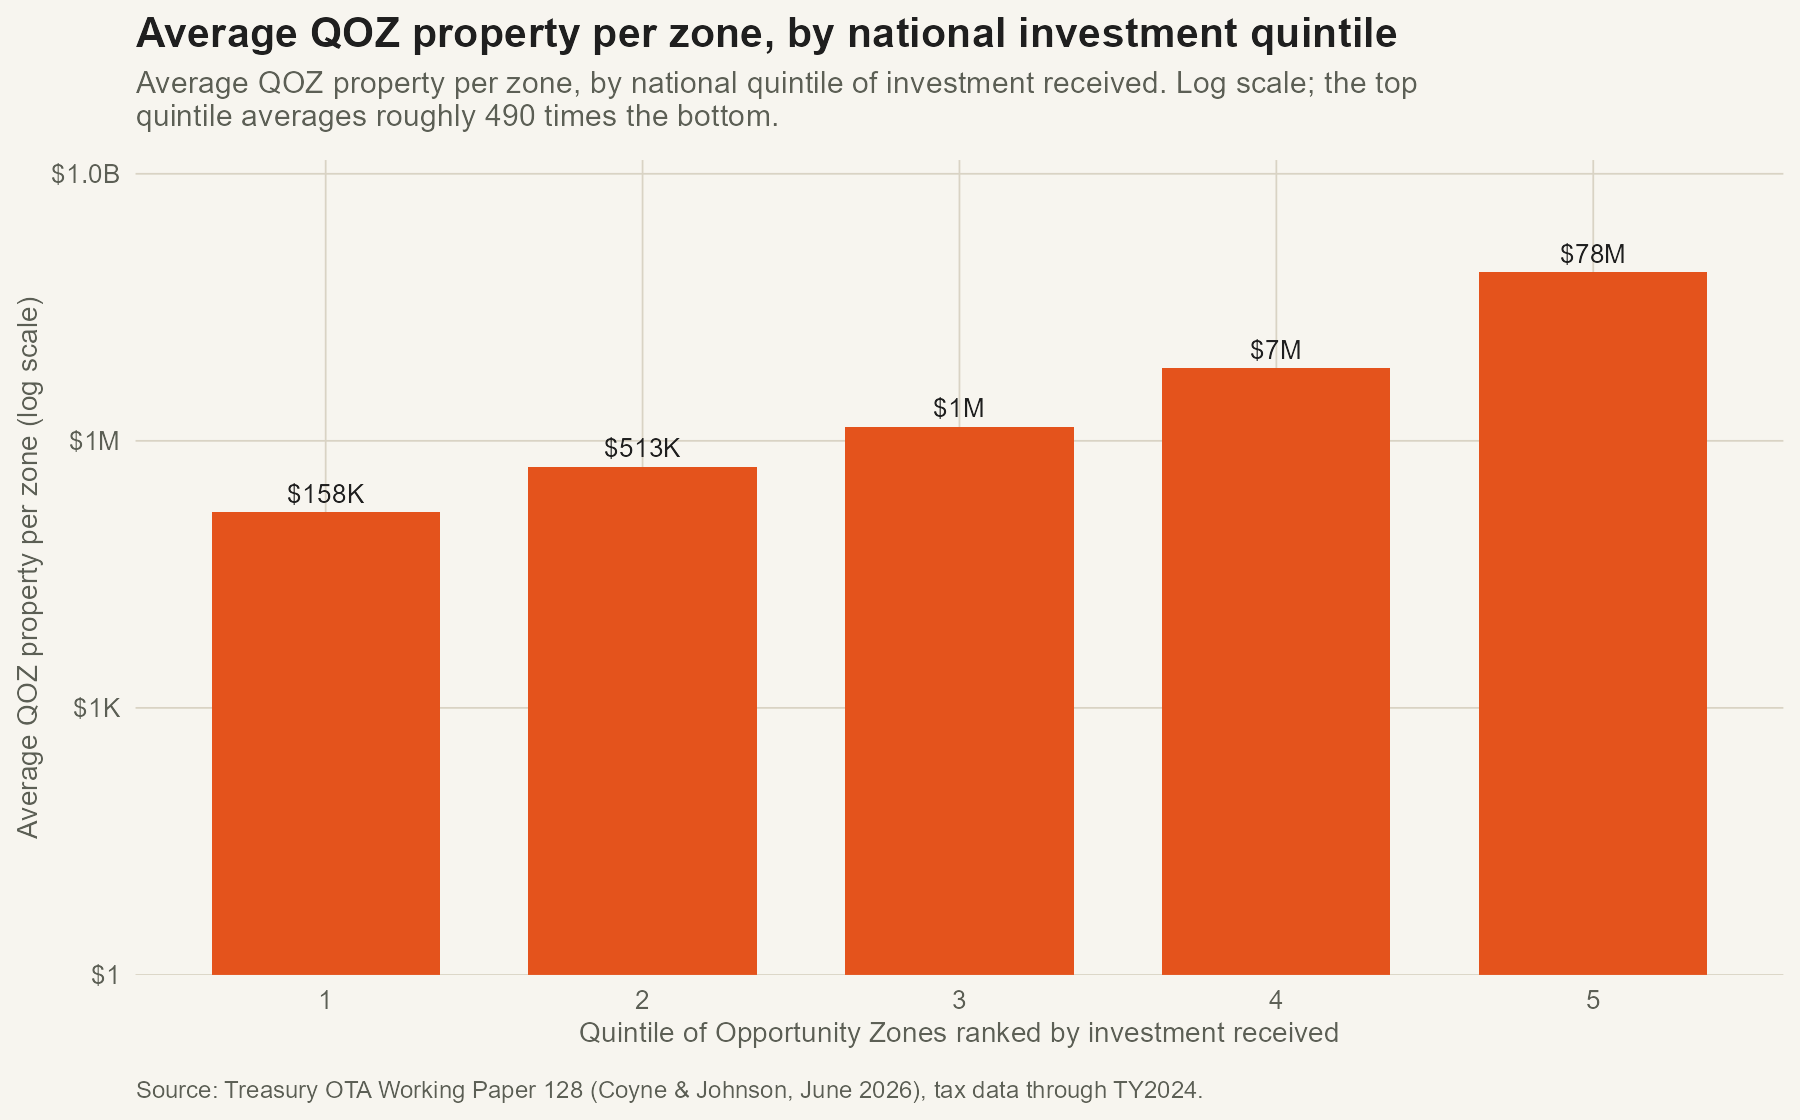
Distribution of investment across zones
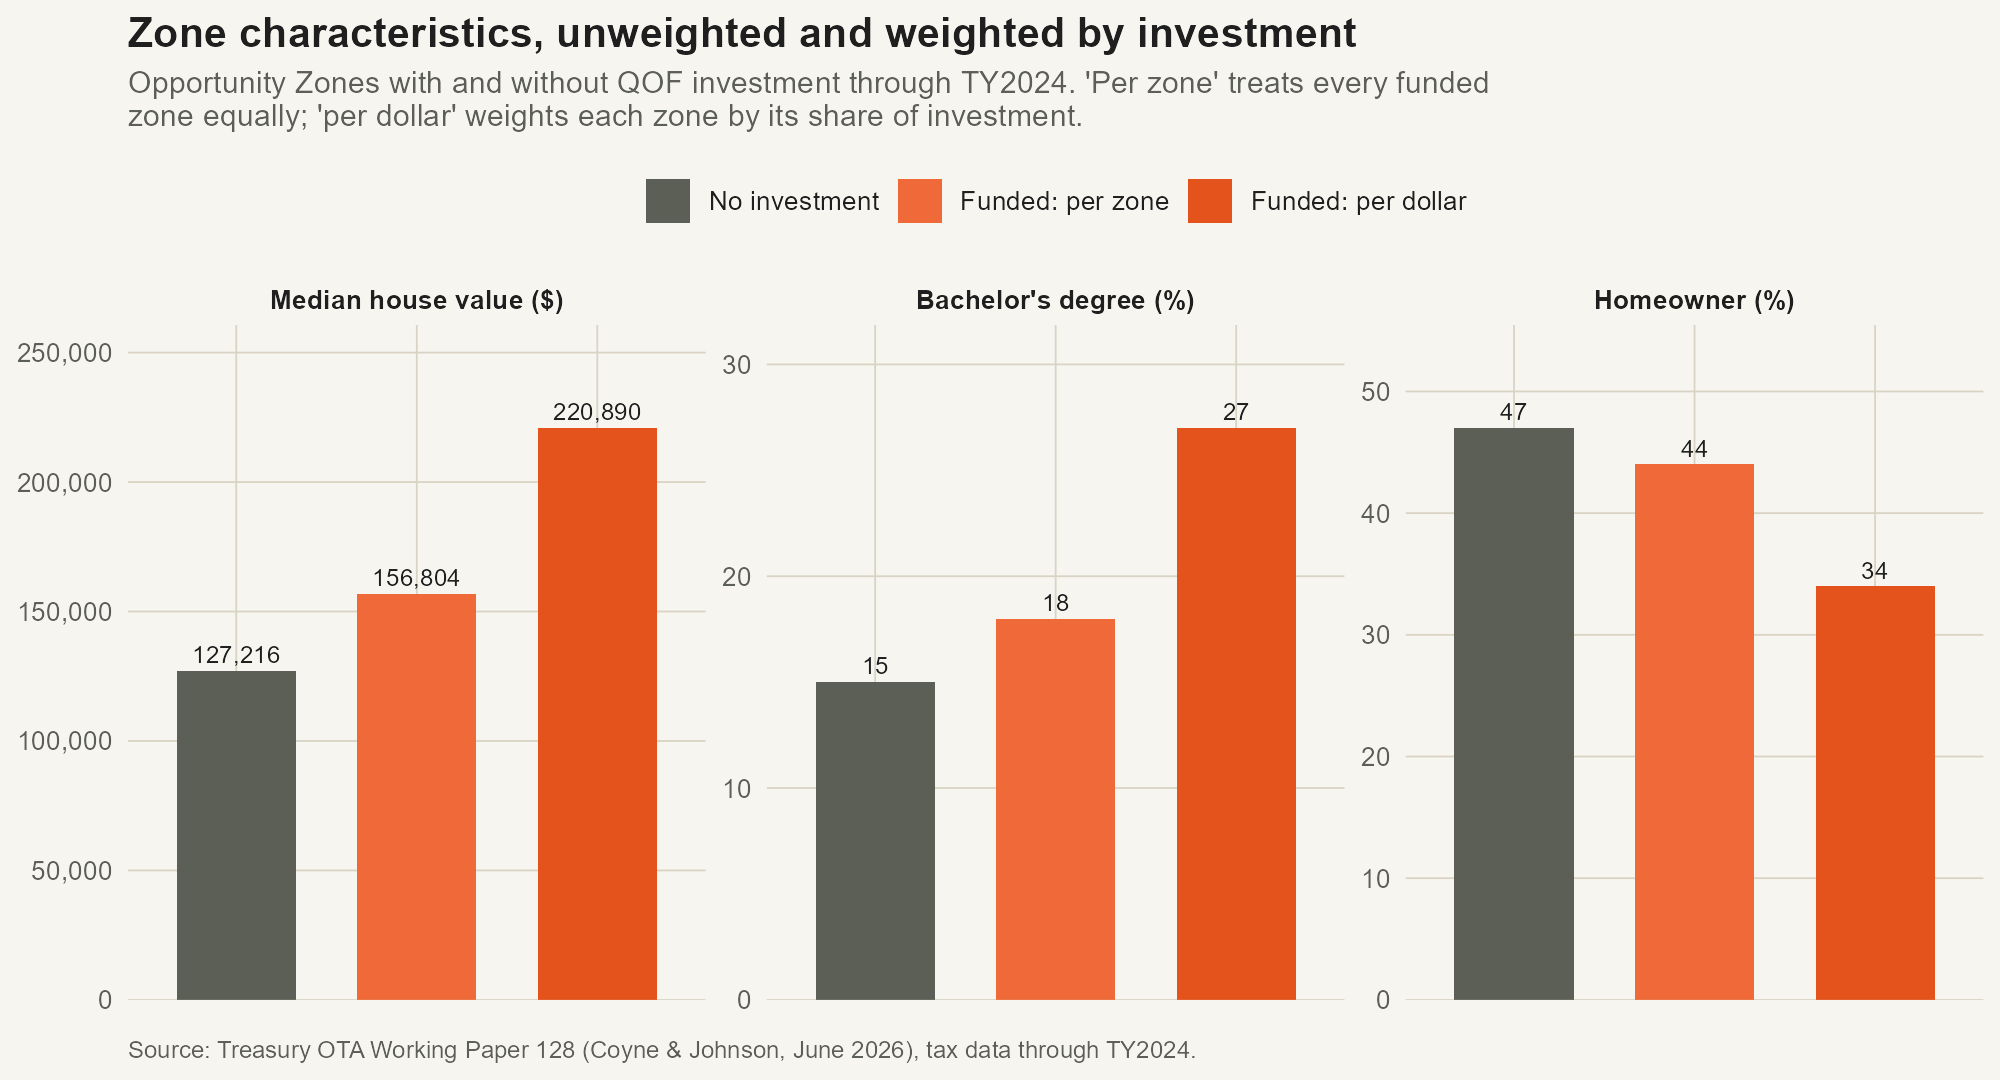
Ranking zones nationally by investment received, the top fifth averaged $78.0 million each and the bottom fifth $158,000, a ratio of about 490 to one. Poverty and unemployment rates are close to flat across the five groups; house values, education levels and renter share differ.
Weighting tract characteristics by investment rather than counting zones equally gives the same pattern. The average funded zone had a median house value of $156,804; weighted by investment the figure is $220,890, against $127,216 for zones with no reported investment.
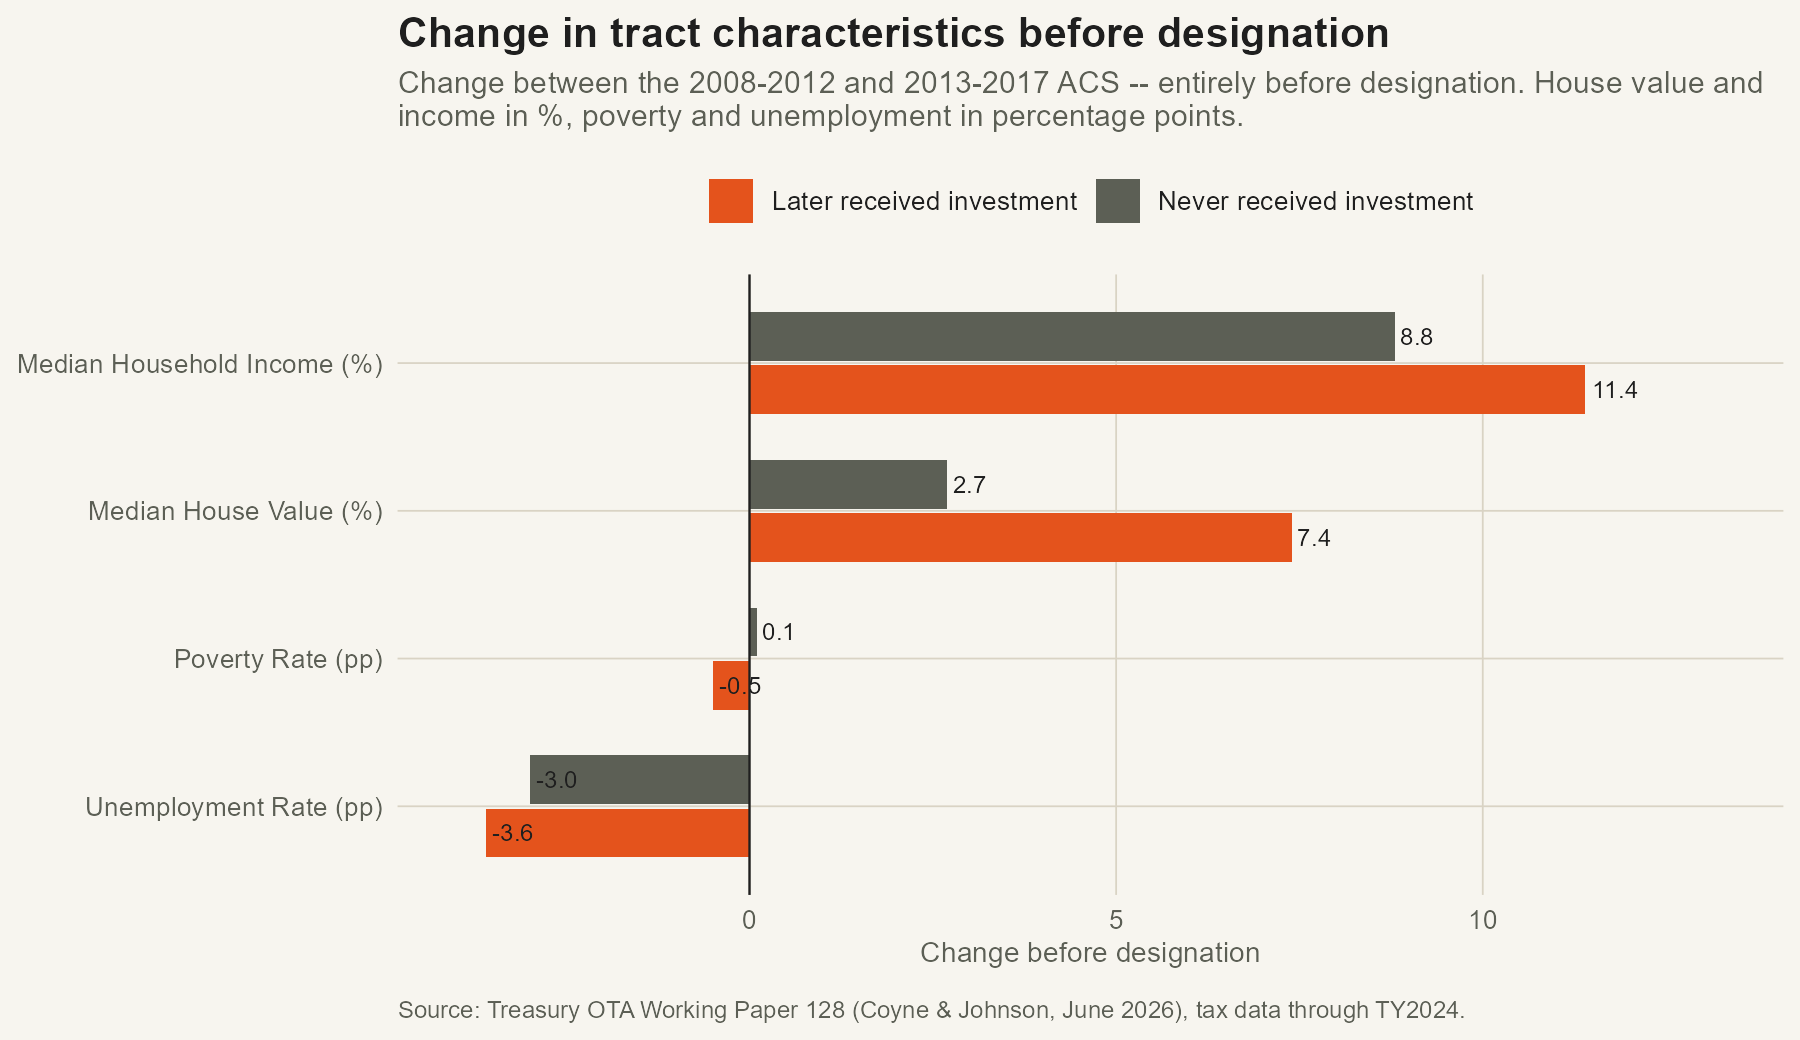
Pre-designation trends
Treasury compares zones that later received investment with those that did not, using the change between the 2008–2012 and 2013–2017 surveys, both before designation. Median house values rose 7.4% in the zones that would later be funded, against 2.7% in those that were not.
Published estimates are consistent with this. Glancy and co-authors (2026) attribute about two-thirds of the increase in Opportunity Zone construction to the selection of tracts where development was already planned. Freedman and co-authors (2025) estimate employment in zones rose 1.3%, with fewer than one in eight of the new jobs going to zone residents.
Programme totals by year
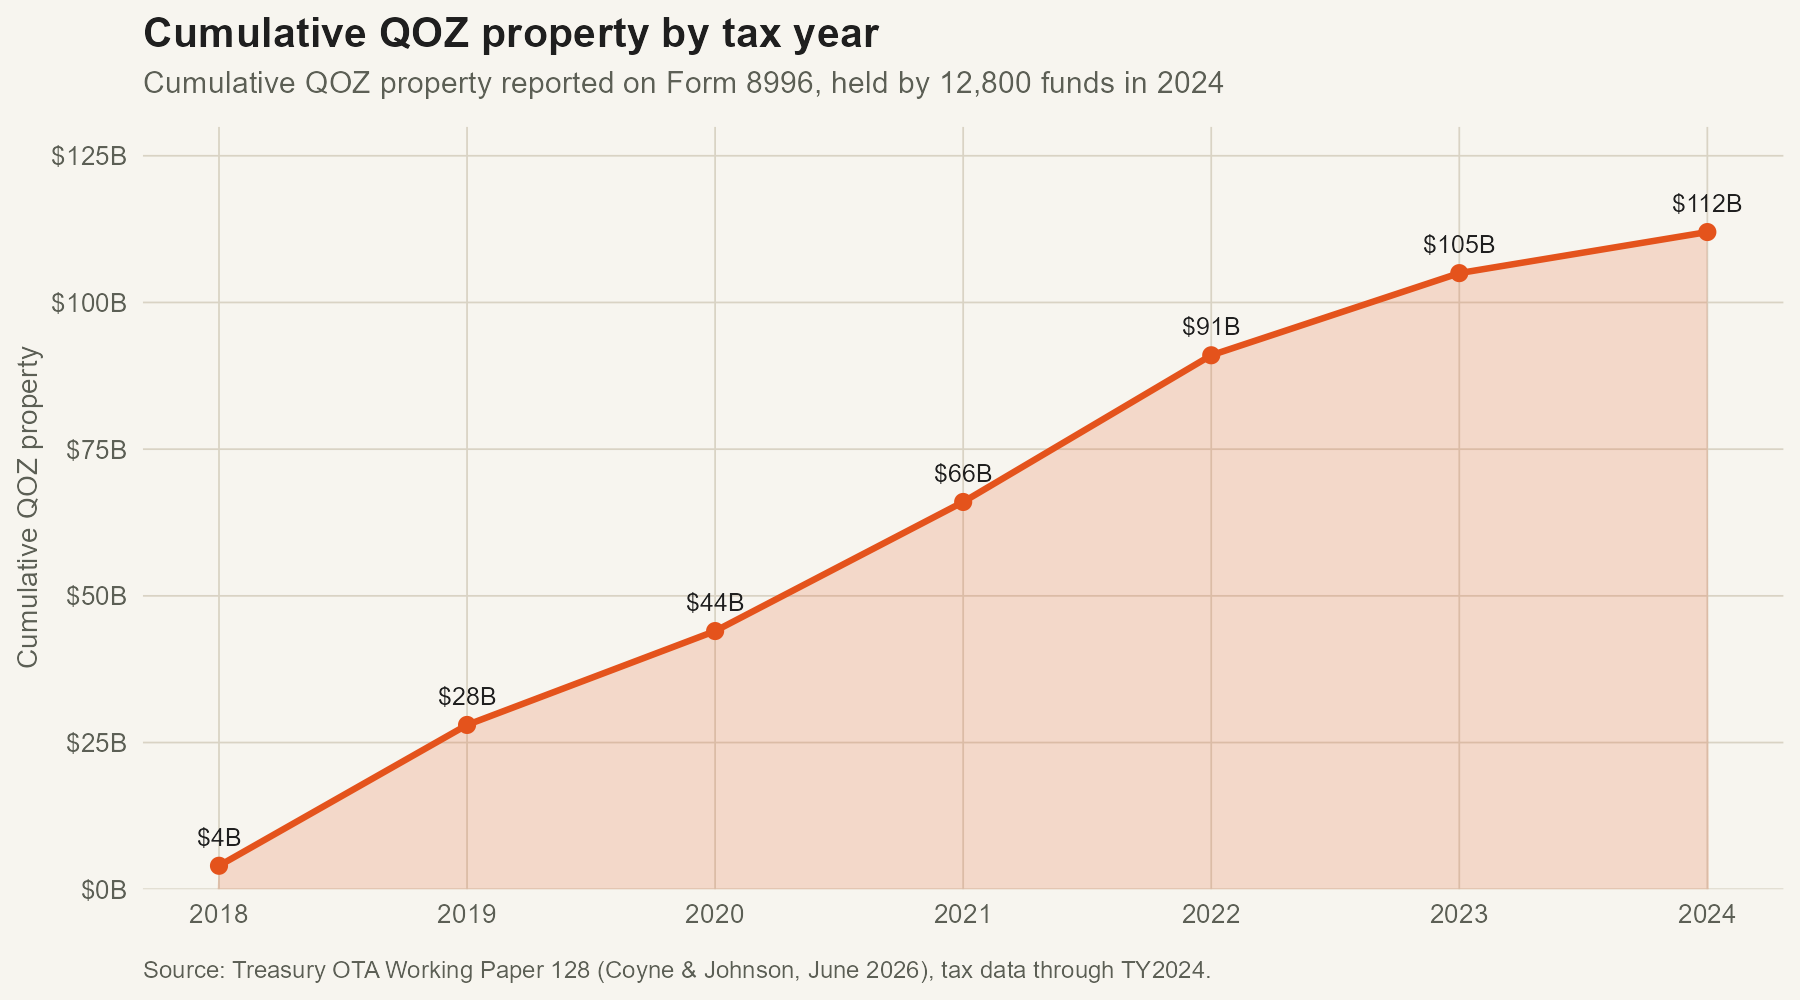
Rural tracts are 37.9% of designated zones and hold 16.1% of reported QOZ property. The 194 tracts designated under the contiguity provision are 2.1% of zones and hold 5.7%. Real estate accounts for 77% of qualified investment.
2027 eligibility
The One Big Beautiful Bill Act made the incentive permanent on a ten-year cycle and changed eligibility in three ways: the income ceiling fell from 80% of the area benchmark to 70%, the poverty route gained a 125% income cap, and the benchmark changed to the CBSA figure for every tract in any CBSA, replacing the "greater of state and metro" test. In 26,882 tracts the new benchmark is lower than the old one.
Matching current zones to the new eligible universe through the Census 2020–2010 relationship file, 26.8% are not eligible.
| Status under 2027 rules | Zones | Share |
|---|---|---|
| Fully eligible again | 5,680 | 65.4% |
| Partly eligible | 681 | 7.8% |
| Not eligible | 2,325 | 26.8% |
Sources and method. Designations from the CDFI Fund (Notices 2018-48 and 2019-42). Tract characteristics from the ACS, 2011–2015 and 2020–2024, on 2010-vintage boundaries. Eligibility reproduced from the statutory low-income community test, validating to within 0.4% of Treasury's published count. Investment from Treasury OTA Working Paper 128 (Coyne & Johnson, June 2026). State investment totals sum to $104.2 billion rather than $112 billion because roughly $7.8 billion of qualified investment was reported without a usable location. Full methodology →